Section 3 - Graph Data Structures
10A.3.1 Adjacency Lists
We will use the following graph for our conversation:
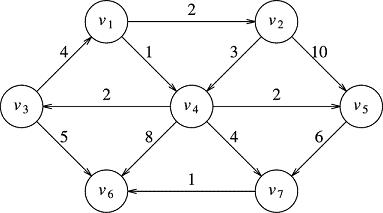
Each vertex label, v1, v2, etc., represents the underlying object data. If we are creating a graph of computer routers, then we would have a class ComputerRouter, and inside each vertex, we would have an individual ComputerRouter reference (perhaps denver.co.ibone.comcast, wrapped in an object). For our discussion and development, we will use simple String data as the underlying object. Therefore, v1 would, in our program, be the String "v1", and v2, the String "v2".
The decision before us is how to represent this graph internally. Surely, we will need to store the vertices. Somehow, we'll want a collection : hash set, array list, ... something to hold them all. Also, we need to represent the edges. Edges will have both directional information and cost information. Here is the general picture, which is just a conceptual organization at this point, not an actual data structure:
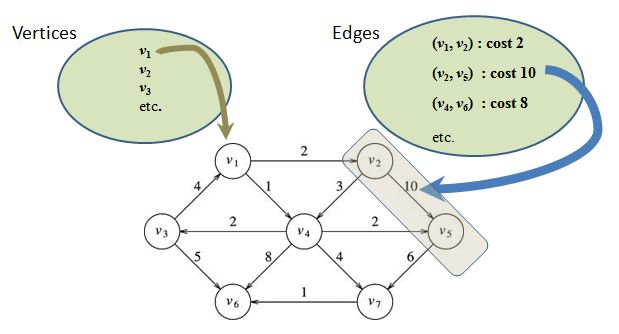
Vertices are easy to discuss. If I want to talk about the vertex v1, I simply write v1. We put all the vertices in a bag and this will be the vertex list for our graph. This is shown in the left oval in the picture above.
The edges will be put into a separate bag with each edge represented by an ordered-pair. For instance, we describe the edge from v2 to v5 using the ordered pair (v2, v5). Note that the edge (v2, v5) is a member of the above graph, but the edge (v5, v2) is not. The ordering tells us what direction the arrow points. Also, if we have a non-directed graph, there are no arrows, so we have a choice, depending on the needs of our algorithm. Either we store both (v2, v5) and (v5, v2) in the list of edges, or we store only one, but do not make use of the distinction between source and destination in the algorithm.
Finally, the cost is added to our informal language when we need it, and omitted when we don't. Usually, we will just say (v2 ,v5) to describe the edge, but if I need to talk about the cost or distance of that edge, I'll add the 10, as in (v2, v5) : 10.
For a directed edge (v2, v5), I will call v2, the source vertex and v5 the destination vertex.
One way to describe all this (without the costs) is by using an adjacency table. All the vertices are listed along the left, and to the right of each vertex we list all the destination vertices that have that left vertex as a source. Let's demonstrate this with the vertex v1. It is the source of two edges, (v1, v4) and (v1, v2). We would then begin constructing the adjacency table by writing out v1's entry in the table, which would look like this:
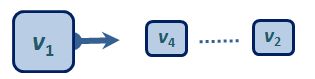
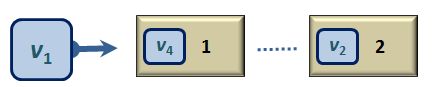
This would be called v1's adjacency list. It tells us that there are two edges with v1 as a source, one has v4 as a destination and the other had v2 as a destination. In other words, this is an alternate way to say the graph contains the edges (v1, v4) and (v1, v2). If we want to include the cost information, we write the cost after each destination vertex, like so:
If we do this for each of the seven vertices in the above graph we will have a full adjacency table -- a complete description of the graph:
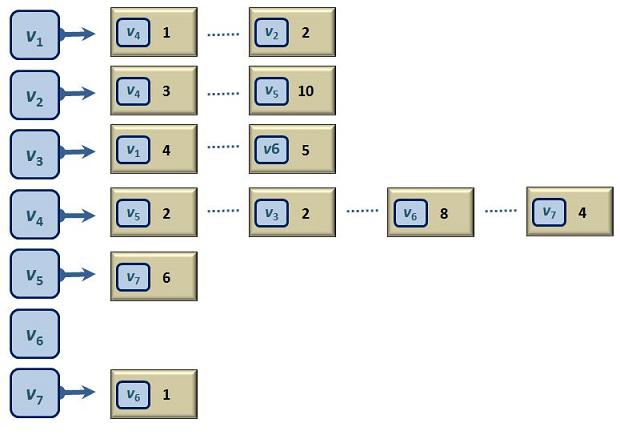
There are a few things to mention here.
- Vertex v6 has an empty vertex list. This expresses the fact that there are no directed edges emanating from v6. It is a destination, but never a source. This doesn't always occur in graphs, but it happens with this particular one.
- There are no duplicate vertices in any adjacency list. This expresses the fact that if edge (v, w) is in the list once, it cannot appear a second time, even if you were to try to distinguish the two appearances using differing costs. You cannot have two edges starting at v and ending at w in the same graph -- at least not in this course.
- The order of the vertices in the various adjacency lists is not important. v4's adjacency list is v5, v3, v6, v7, but it could have been v6, v5, v7, v3.
- Edges are not wrapped up in a single entity in this table. The edge (v4, v3) does not appear there as such. You can't circle anything in the table and say "here is edge (v4, v3)." The edge's existence is implied by the fact that v3 appears somewhere in v4's adjacency list.
Comparing the original pictorial circle/arrow representation with the new adjacency table model, we see it is easier for the human brain to answer questions about the graph using the picture. However, the computer program must work with the adjacency table. That's why human programmers always use pictures of graphs to study them and to design algorithms, but they then program these algorithms using a data structure like an adjacency table, if not exactly an adjacency table.